This article is one in a series on rooftop solar panels in the UK and is intended to help those considering solar panel installation. It explores some of the issues with matching your home electrical energy consumption with solar energy electricity generation from rooftop solar PV panels.
Our conclusion is that, without battery storage, it is hard to use more than 40% of the solar energy generated by a 4 kW solar panel array installed on the rooftop of your house. This means that around 60% of the solar energy must be exported to the electricity grid for use by others. Without shifting demand for electricity, a maximum of 66% of home electricity consumption can be satisfied in the peak month for solar output (May) even with a huge increase in the size of the solar pv panel array.
For new solar pv installations, exports to the grid will be covered by the Smart Export Guarantee (SEG) legislation which comes into effect in January 2020. Details of specific SEG export payment rates and durations from different energy companies have yet to be published.
Annual Electricity Consumption
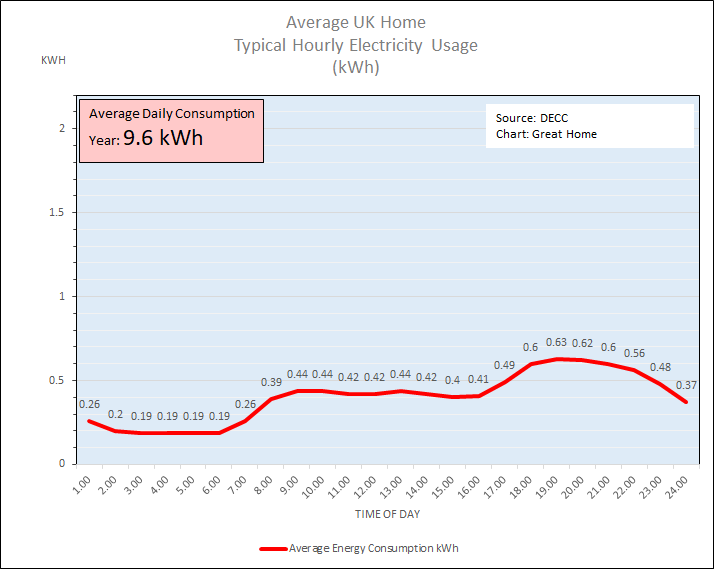
The typical UK home uses around 3,500 kWh of electricity per year, an average of 9.6 kWh per day, assuming that space and water heating in the home is provided by gas from a central heating boiler boiler rather than using electricity. Chart 1 below shows typical hourly usage for a home at least partially occupied during the day. Note the “background” energy consumption of around 0.19kWh even during the early hours of the morning. This is demand from appliances on standby mode such as TV’s, set top boxes & computers together with routers, printers, fridges, alarm systems, and freezers. Peak demand is around 6-7pm when homes are often fully occupied. Winter months will see slightly higher demand, due to extra lighting and people spending more time indoors than in the summer.
See how your own energy demand compares to other houses in your area using our Average Energy Consumption Calculator (opens in new tab).
Chart 1: Typical Hourly Electricity Usage for the Average UK Home
Solar Energy Usage In the Home
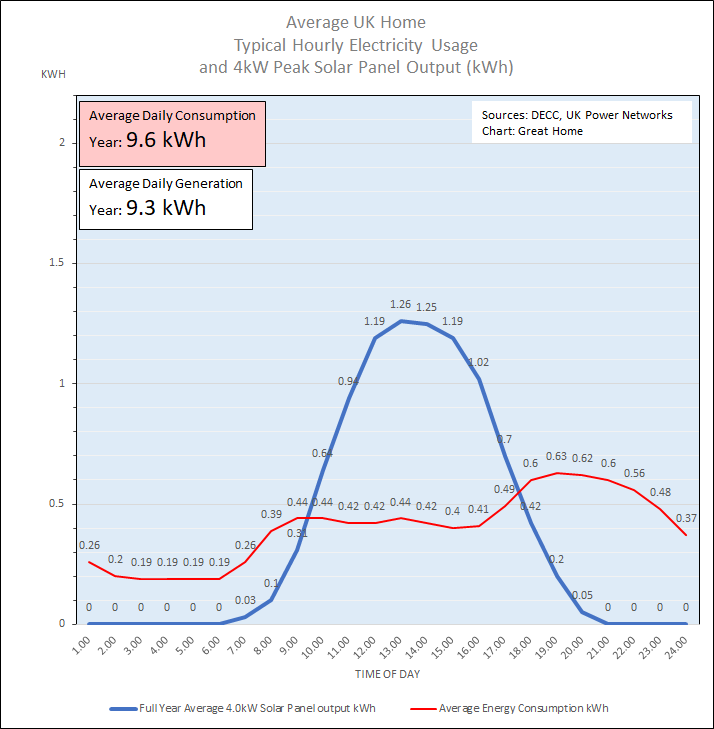
A homeowner investing in a 4kW Peak solar array (typical cost £7,264 inc VAT) might think that its solar electricity generation of around 3,400 – 4,000 kWh per year (9.3- 11.0 kWh per day) could provide most of the electricity for their home. So it may come as a surprise to find that, without using battery storage, throughout the year only around 40% of the solar energy produced by the solar pv panels can be used in the home, with 60% having to be exported to the grid. If we assume annual solar pv electricity generation of 3,400 kWh (9.3 kWh per day) then Chart 2 shows that much of the solar energy is produced in the middle of the day (the blue line) with much of the solar output (50%) exported to the grid.
The chart shows the average hourly generation figure for the year. This is a much simplified picture as output varies widely by day and also seasonally (by upto a factor of 10 as we will see later). The data comes from a UK Power Network Study carried out from October 2013 to September 2014.
Chart 2: Typical Hourly Solar PV Electricity Generation
Solar PV Electricity Generation In December
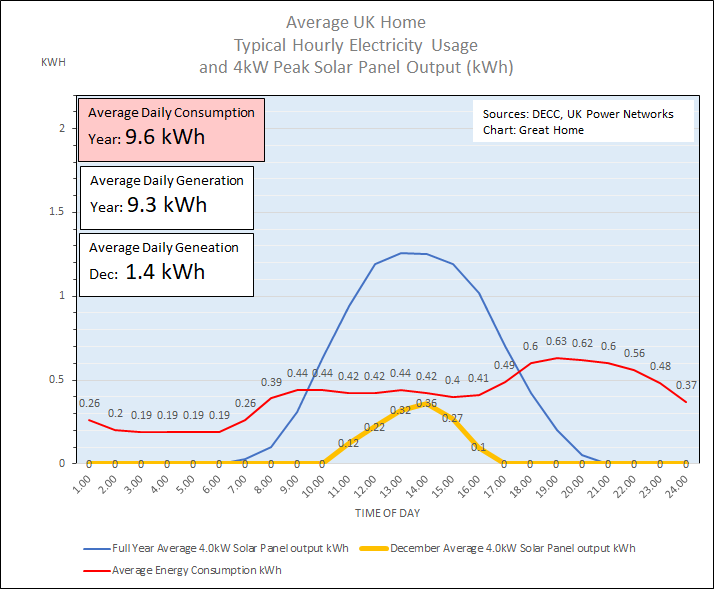
Chart 3 shows (yellow line) the average daily solar energy generated during December 2013. Solar generation is only possible between about 9am and 4pm, amounting to 1.4kWh of energy per day and providing only 15% of the home’s daily energy demand. The home does consume 100% of the electricity it generates and exports 0% to the grid. Without shifting demand, even with a huge increase in the size of the solar pv panel array, a maximum of 31% of home electricity demand can be satisfied in December; 61% of typical consumption occurs at times when there is little or no sunlight.
Chart 3: Hourly Solar PV Electricity Generation In December
Solar PV Electricity Generation In May
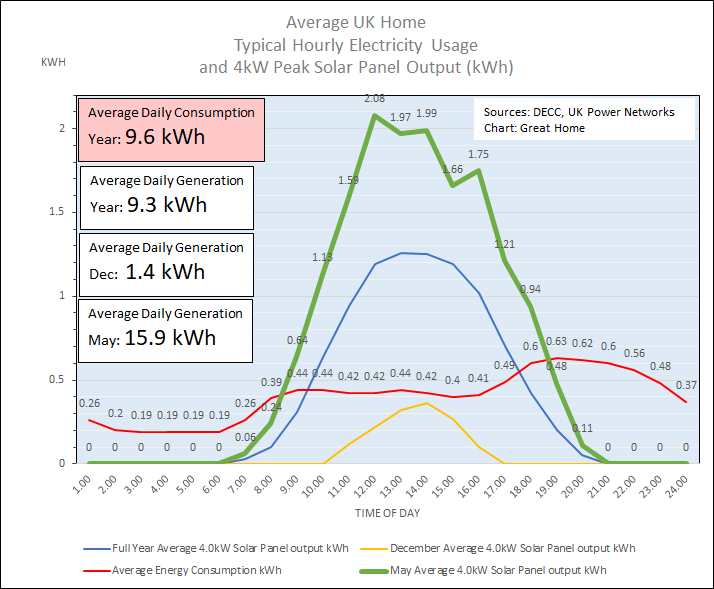
Chart 4 shows (green line) the average hourly output for May 2014. May is usually the peak month for solar energy generation in the UK. Only 5.37 kWh (34%) of the 15.9 kWh average daily solar generation for May is used to power the typical home, with 66% of solar generation exported to the grid. Solar energy generation is possible from 5am to 8pm. In total 56% of home electricity consumption is provided by solar generation. Without shifting demand, a maximum of 66% of home electricity demand can be satisfied in May.
The jagged nature of the peak area of the green line illustrates the impact of a variety of different weather conditions experienced in May 2014. Theses figures are themselves an average. In reality, output varies minute by minute, depending on cloud cover and shading.
Chart 4: Hourly Solar PV Electricity Generation In May 2014
Summary
Part 1 of this series of articles shows, for those planning a solar panel installation, some of the challenges of trying to power your home using solar panels alone. Charts 1-4 show it is clearly unrealistic to do this, even on the sunniest of days, without using electricity storage and that around 60% of solar pv panel electricity generation will have to be exported to the grid. Without shifting demand, a maximum of 66% of home electricity demand can be satisfied in May (with solar energy generation between 5am and 8pm) even with a huge increase in the size of the solar pv panel array. For December this drops to 31% of home energy demand (with solar energy generation only possible from 9am to 4pm).
In Part 2 we will look at how battery storage can help daily time-shifting of energy to better balance solar generation and home energy consumption.
Data Sources:
- UK Power Networks: Validation of Photovoltaic (PV) Connection Assessment Tool Closedown Report.
- UK Power Networks: (PV) Solar Panel Energy Generation data at https://data.london.gov.uk/dataset/photovoltaic–pv–solar-panel-energy-generation-data
- DECC Household Electricity Study: https://www.gov.uk/government/collections/household-electricity-survey
Leave a Reply