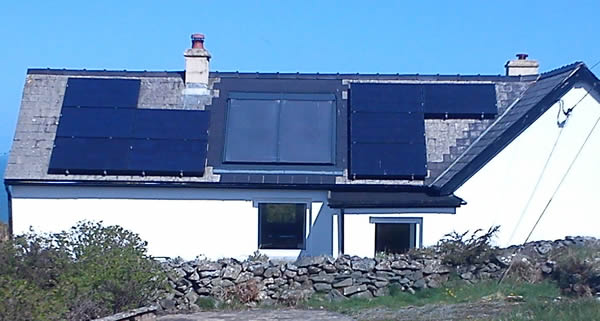
To give an example of the income and savings from using Solar PV panels (Photovoltaic) to generate electricity, the installation shown above has 9 x 0.25kWp panels (5 on the left of the roof, 4 on the right). This gives a peak generation capacity of 2.25kWp. We are using the payment rates planned for a new installation from 15 January 2016.
Over a 12-month period this particular installation, situated in South Wales, generated 2,200 kWh of electricity. It is assumed that 50% of this electricity is used in the property and 50% is exported to the electricity grid. It also assumes Feed In Tariff payments of 4.85p for electricity export to the grid and the current rate for new installations of 4.39p for electricity generation.
- Annual maintenance allowance: -£60 per year (assume inverter replaced after 10-15 years).
- Electricity bill savings: 1100 kWh x £0.13 = £143 per year.
- Feed In Tariff payment for solar electricity generation = 2200 kWh x £0.0439 = £96 per year
- Feed In Tariff (FIT) payment for electricity exported = 1100 kWh x £0.0485 = £53 per year.
- Total savings and income: £232 per year
Around 50% of the payments are in effect a subsidy from the electricity industry.
If we look at a snapshot of the electricity generated for a typical week in April we get the following daily output (rounded to nearest kWh):
- Monday: 4 kWh
- Tuesday: 10 kWh
- Wednesday: 3 kWh
- Thursday: 4 kWh
- Friday: 13 kWh
- Saturday: 11 kWh
- Sunday: 5 kWh
Total generated in week 50 kWh.
From the daily data it shows the big variation between the worst day for generation, a rainy and overcast Wednesday when 3 kWh was generated and Friday when 13 kWh was generated. It is obvious but important to say that the better the local weather conditions the more power can be generated. This particular week would have generated electricity savings and income of around £16.
As a guide, in June upto 100 kWh per week could be generated, in mid-December you would be lucky to produce 5kWh per week.
Leave a Reply